INSTITUTE INDEX: Felony disenfranchisement and the South's lost voters
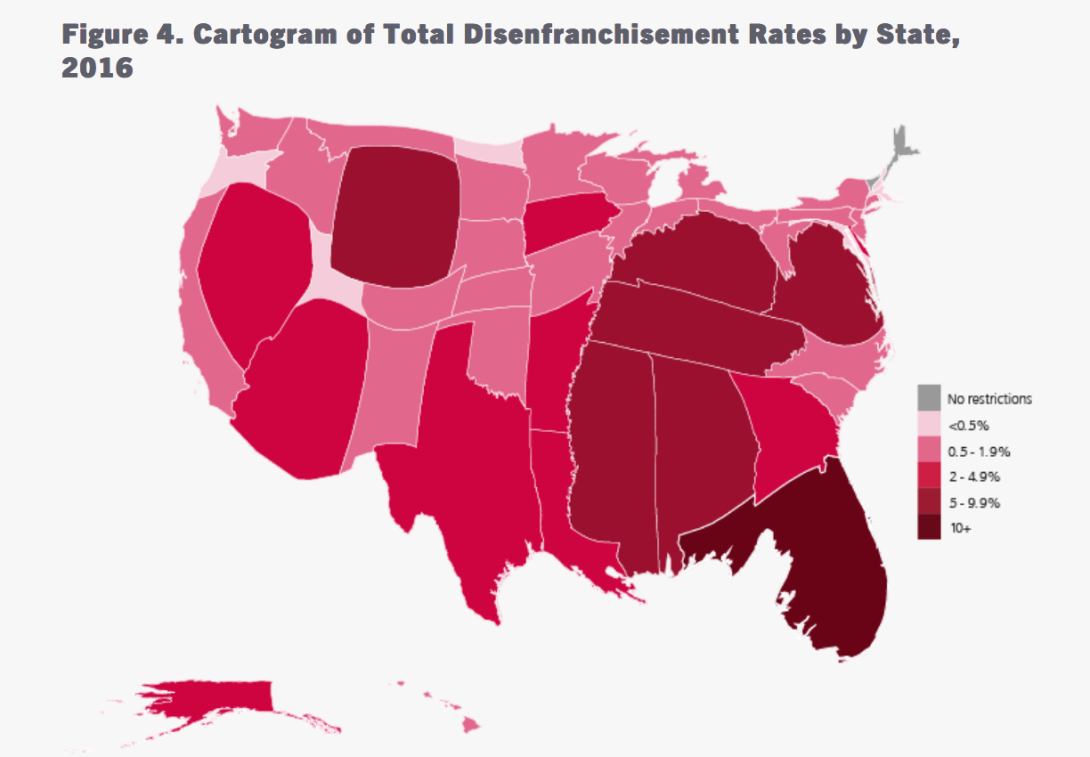
This cartogram showing relative felony disenfranchisement rates by state is from "6 Million Lost Voters: State-Level Estimates of Felony Disenfranchisement, 2016" by The Sentencing Project.
Number of Americans who were forbidden from casting ballots in 1976 due to state laws restricting voting rights for people convicted of felony crimes: 1.17 million
In 1996: 3.34 million
Today: 6.1 million
Portion of those disenfranchised who are currently incarcerated: less than 1/4
Number of states where more than 7 percent of the population is disenfranchised because of such laws: 6
Of those 6 states, percent in the South: 100*
Rank of Florida's disenfranchisement rate among all the states: 1
Percent of the disenfranchised population nationally represented by Florida alone: 27
Total number of Floridians who've been disenfranchised because of felony convictions: nearly 1.5 million
Number of votes that separated presidential candidates George W. Bush and Al Gore in Florida in 2000: 537
Portion of African Americans nationally who've been disenfranchised because of such laws: 1 in 13
Number of states where more than 1 in 5 African Americans has been disenfranchised: 4
Of those 4 states, percent in the South: 100**
Year in which the Alabama legislature eased the voting rights restoration process after people not convicted of a crime of "moral turpitude" complete their sentence: 2016
If state laws were changed to restore voting rights for people on probation or parole who are currently supervised in their communities — principles most Americans endorse — percent of those currently disenfranchised whose voting rights would be restored: 77
* Alabama, Florida, Kentucky, Mississippi, Tennessee and Virginia.
** Florida, Kentucky, Tennessee and Virginia.
(Click on figure to go to source. The numbers in this index are from "6 Million Lost Voters: State-Level Estimates of Felony Disenfranchisement, 2016" by The Sentencing Project.)
Tags

Sue Sturgis
Sue is the former editorial director of Facing South and the Institute for Southern Studies.