INSTITUTE INDEX: Will Congress let poor children go hungry?
Percent of those receiving WIC benefits who are infants and children: 77
Percent of the U.S. poverty line that applicants' gross income must fall at or below in order to be eligible for WIC assistance: 185
Annual income that represents for a family of four: $41,348
Number of eligible women and children who would be turned away from the non-entitlement program next year due to funding cuts in the House appropriations bill passed in June: more than 700,000
Number of eligible women and children who would be turned away from the program in the 13 Southern states*: 250,800
Date on which Rep. Jack Kingston (R-Ga.), chair of the House Appropriations Committee's agricultural subcommittee, defended the cuts as a way to make the government more efficient: 5/24/2011
WIC funding cut approved by the Senate Appropriations Committee earlier this month: $152 million
Percent by which the Senate funding level estimated that WIC food costs would grow next year: 2
If WIC food costs remain at the level reported in June for the remainder of this fiscal year and through the next, with no further food price inflation, percent by which WIC food costs would actually grow next year: 3.8
Under that scenario, additional funding the program would need to avoid turning away anyone in need: $42 million
In 2010, percent of U.S. households that experienced food insecurity, meaning they did not always have access to enough food for all household members: 14.5
Number of people that represents: 48.8 million
Percent of households with children headed by a single woman who experienced food insecurity: 35.1
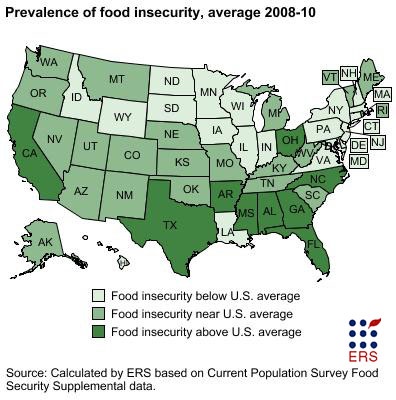
Of the 13 Southern states, number where food insecurity was above the U.S. average between 2008 and 2010: 7**
Percentage of households that experienced food insecurity during that period in Mississippi, the state with the highest rate: 19.4
* AL, AR, FL, GA, KY, LA, MS, NC, SC, TN, TX, VA and WV
** AL, AR, FL, GA, MS, NC and TX
(Click on figure to go to source. Map from the USDA's Economic Research Service website.)
Tags

Sue Sturgis
Sue is the former editorial director of Facing South and the Institute for Southern Studies.