Redlining Black Faces
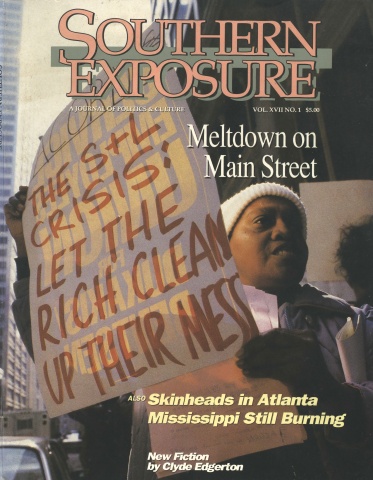
This article originally appeared in Southern Exposure Vol. 17 No. 1, "Meltdown on Main Street." Find more from that issue here.
Regina Robbins asked the caller to hold on while she got to another phone. She wanted to answer his question outside earshot of her co-workers.
“No, there are no blacks on the board of directors of this savings and loan,” she began in a soft voice. “I’m the only black person who works here, and they have me right out front. There’s a black man who is a loan officer at one of the branches — but that’s all of us.
“You know what’s so disturbing to me,” she volunteered. “Most of the customers I see come through here are black. That’s right. Mostly older people, black people. I’m not sure about who gets the loans, but they’re the ones who come in to make deposits. They’re the ones standing in line to do business at the tellers’ windows.”
As the only black secretary to an S&L president in one of the South’s largest metropolitan areas, Regina asked us to change her name and not to reveal where she works. Her comments — and her isolation — go to the heart of the widespread discrimination that exists in the employment and lending practices of the savings and loan industry.
Information gathered from the Equal Employment Opportunities Commission, Federal Home Loan Bank Board, and our own phone calls reveals that race and sex — not income or ability — generally determine who makes policy decisions at S&Ls, who takes the good jobs, and who gets loans. The data also reveals that redlining — the practice of denying loans to black and low-income communities — continues unabated, and may have grown worse in recent years.
Consider these highlights:
· In Arkansas, Alabama, Kentucky, North Carolina, Tennessee, Mississippi, and West Virginia, there are no blacks on the boards of the top 10 S&Ls ranked by assets as of September 30, 1987. In most cases, these thrifts hold a majority of the loans made by all S&Ls in the state. The boards in Georgia, Louisiana, South Carolina, and Texas have only one black and no other minority members. In Tennessee and South Carolina, there are no women of any race on the policymaking boards.
· Most top salaried posts at S&Ls nationwide are also reserved for white men. Fifty-five percent of all white men are concentrated in managerial and professional jobs, while 63 percent of black, Hispanic, and Asian men are blue collar, service, or clerical workers. Minority men nationwide hold fewer than one in 10 white-collar jobs (not including secretaries).
In the South, the figure drops to one in 12.
Nationally, women make up a majority of the industry’s workforce — 69 percent — but two out of three are confined to clerical jobs. In the South, seven in 10 women fill clerical roles.
· Blacks are rejected more than twice as often as whites when they apply for home loans from S &Ls — regardless of their income. The nationwide rejection rate for loan applicants of all incomes is 11.1 percent for whites, 12.2 percent for Asian-Americans, 16.5 percent for native Americans, 18.2 percent for Hispanics, and 23.7 percent for blacks.
In 85 of the 100 largest metropolitan areas, high-income blacks were rejected more often than low-income whites in at least one year between 1983 and 1988. The city’s size, population mix, and racial-income differences had little effect on the size of the gap between black and white rejection rates.
Women and single applicants were also denied loans more often than men and married couples. Women were rejected 13 percent more often than loan requests with at least one male applicant, and single applicants were denied loans 20 percent more frequently than married applicants.
Good Ol’ Boys
S&L officials are reluctant to see racial overtones in any of these statistical patterns, much less tie them together as evidence of the institutional racism that pervades the industry. Earlier this year, the Atlanta Constitution’s embarrassing coverage of the racial disparities in home loans left industry leaders scratching their heads. “Perhaps we need to have our research department do a little research on that and see if we can’t come up with some reason,” said Barney R. Beeksma, chairman of the U.S. League of Savings Institutions, the industry’ s largest trade association.
“As for people being discriminated against because they’re black or minority, I’ve never heard of that,” he added. “Many of those applications from blacks may be coming out of very depressed neighborhoods. On the other hand, most people who can’t qualify don’t even apply or they’re weeded out by a realtor because they don’t have the income.”
“I admit I probably don’t have a good answer for [the disparity],” Beeksma concluded.
Others are less stupefied. “The lily-white make up of the boards of directors goes a long way toward explaining the racial disparity in employment and loan practices,” said Meredith Emmett, executive director of the Institute for Southern Studies, which studied the racial composition of S&L boards across the region. “The same good-ol’-boy network that excludes blacks, Hispanics, and women from their policy-making circles also ignores outreach programs that would attract minority home buyers.” Pat Funderbunk, a board member of the Southeast Raleigh Community Development Corporation, agreed. “If you don’t make sure there is input from the people whom you serve, it will be difficult to effectively address their needs,” she explained.
Studies also disprove the industry’s claim that blacks represent a greater credit risk than whites. The Self-Help Credit Union, based in North Carolina, has documented that home loans made to minority applicants are just as profitable as those made to whites. Its integrated staff and board have put programs in place to identify and serve low-income potential homeowners.
“We’re picking up business these other guys just don’t see is out there,” said Errol Gabay, a loan officer at the credit union.
Down the street at First Federal Savings and Loan of Durham, president James H. Sparger said his S&L has never considered naming a black to its board during his 12- year tenure. But, he quickly added, “We do not redline. We go anywhere there are qualified borrowers in our lending territory.”
First Federal is a subsidiary of Firstcorp Inc., the largest S&L complex in the Raleigh-Durham area. According to federal records, blacks are denied home mortgages from area S&Ls 3.7 times more often than whites.
The Bottom Line
News reports about racial disparities in lending and board makeup are only the latest skirmish in a long battle. For years, industry officials have simply denied that discrimination exists. Echoing the party line, Thad Woodard, president of the North Carolina League of Saving Institutions, recently asserted, “Our people are responsive to the needs of minorities. They are bottom-line oriented, and the bottom line is color blind.”
Critics, however, have focused less on the personal biases or morality of individual lenders than on monitoring the actual lending and employment practices and the need for affirmative action remedies to correct the inherent limitations of any good-ol’-boy system.
In 1976, 10 civil rights and housing groups sued the entire bank regulatory system for failing to enforce anti-discrimination provisions in the 1968 Fair Housing Act and the 1974 Equal Credit Opportunity Act. As part of the suit’s settlement, three agencies began collecting data on all loan applications, but within a few years two of the agencies stopped. Only the Federal Home Loan Bank Board (FHLBB), which is responsible for regulating thrifts, continued collecting the data — but it has never analyzed the results.
Bill Dedman of the Atlanta Constitution obtained FHLBB data covering over 10 million loan applications and $1 trillion in home loan requests to the nation’s S&Ls from 1983 to mid-1988. According to Dedman, “The loan records suggest that redlining — refusing to lend in an area because of race — has persisted and may have grown worse in the 1980s as federal regulators decreased enforcement of fair-lending laws.”
As evidence, he points to a 1974 federal study which found a black-white gap in loan rejection rates only half what it is now in 13 of the 17 cities surveyed. The gap has gotten worse over the past 15 years in such cities as Atlanta, Baltimore, Chicago, Jackson, Memphis, Tampa-St. Petersburg, Topeka, and Washington.
The black-white disparity in rejection rates for the 1980s was widest in the Plains (30.9 percent black vs. 12.6 percent white) and the Midwest (29.6 percent vs. 12.2 percent), even though blacks in the two regions have the nation’s highest incomes relative to whites. The gap was slightly narrower in the South (24.1 percent vs. 10.2 percent), where blacks have the lowest income relative to whites. It was smallest in the West (25.1 percent vs. 14.4 percent) and the Northeast (13.4 percent vs. 9.1 percent).
Even the industry admits that federal regulators have never used such data to enforce fair lending laws. “To my knowledge, the Equal Credit Opportunity Act statistics have never been anything more than a collection of data,” said U.S. League chairman Beeksma. “I’ve never heard of an examiner coming in and saying, ‘You’re rejecting more blacks than whites. You’re doing this wrong.’”
“A Bad Time”
In fact, bank regulators have not referred a single case of credit discrimination to the Justice Department for prosecution since 1978. Under the Reagan administration, the Department of Housing and Urban Development quit collecting loan data vital to monitoring redlining. The hours that bank regulators devoted to consumer regulations dropped 74 percent from 1981 to 1984. And the Office of the Comptroller of the Currency now examines die lending practices of no more than 50 of the nation’s 4,500 banks each year, meaning a bank could go 128 years without such an exam.
For federal S&L regulators, the recent flood of bankruptcies has provided something of an alibi for not enforcing anti-discrimination laws. “I regret to report that, as a result of this situation, we did not allocate sufficient resources to the enforcement of . . . consumer-related issues,” FHLBB Chairman M. Danny Wall told a Senate committee last March.
“It’s been a bad time,” pleaded Richard Tucker, director of the FHLBB’s Office of Community Investment, almost a year later. “The question is now, what are we going to do with this data while we struggle with our other responsibilities for safety and soundness?”
Putting a priority on restoring the industry’s solvency while ignoring its widespread discrimination continues to give S&Ls and government regulators an out. Citizens groups concerned about redlining have taken a more direct and uncompromising approach.
“There can be no bailout of the S&Ls without an end to redlining, and a commitment to greenlining — to investing in those people and areas that have been discriminated against in the past,” Jesse Jackson said at a March 2 press conference to kick off the Financial Democracy Campaign, a broad national coalition of nearly 200 groups that is making the connection between the S&L bailout and the housing crisis.
“Even as the buccaneer bankers were gambling millions of dollars on fly-by-night ventures, they were systematically denying loans to African Americans and Hispanic Americans of solid reputation and stable income seeking mortgages for their homes or loans for their small business,” Jackson said. “This redlining of cities and barrios ensures the development of a slum.
“The crisis must be addressed,” he concluded. “The question is how to address it fairly. We say the remedy should fit the cause.”
Tags
Bob Hall
Bob Hall is the founding editor of Southern Exposure, a longtime editor of the magazine, and the former executive director of the Institute for Southern Studies.